There are no projects in the garbage can.
General Information
Cytometry is a powerful technique that allows the analysis of sample characteristics by reading fluorescence or heavy metals. Applications of the technology include immunofluorescence analysis, cell cycle and proliferation analysis, fluorescent protein analysis among many others. The main advantages of this technique are accuracy and speed. It can analyze millions of cells in a matter of minutes and collect data from every cell that passes through the analyzer.
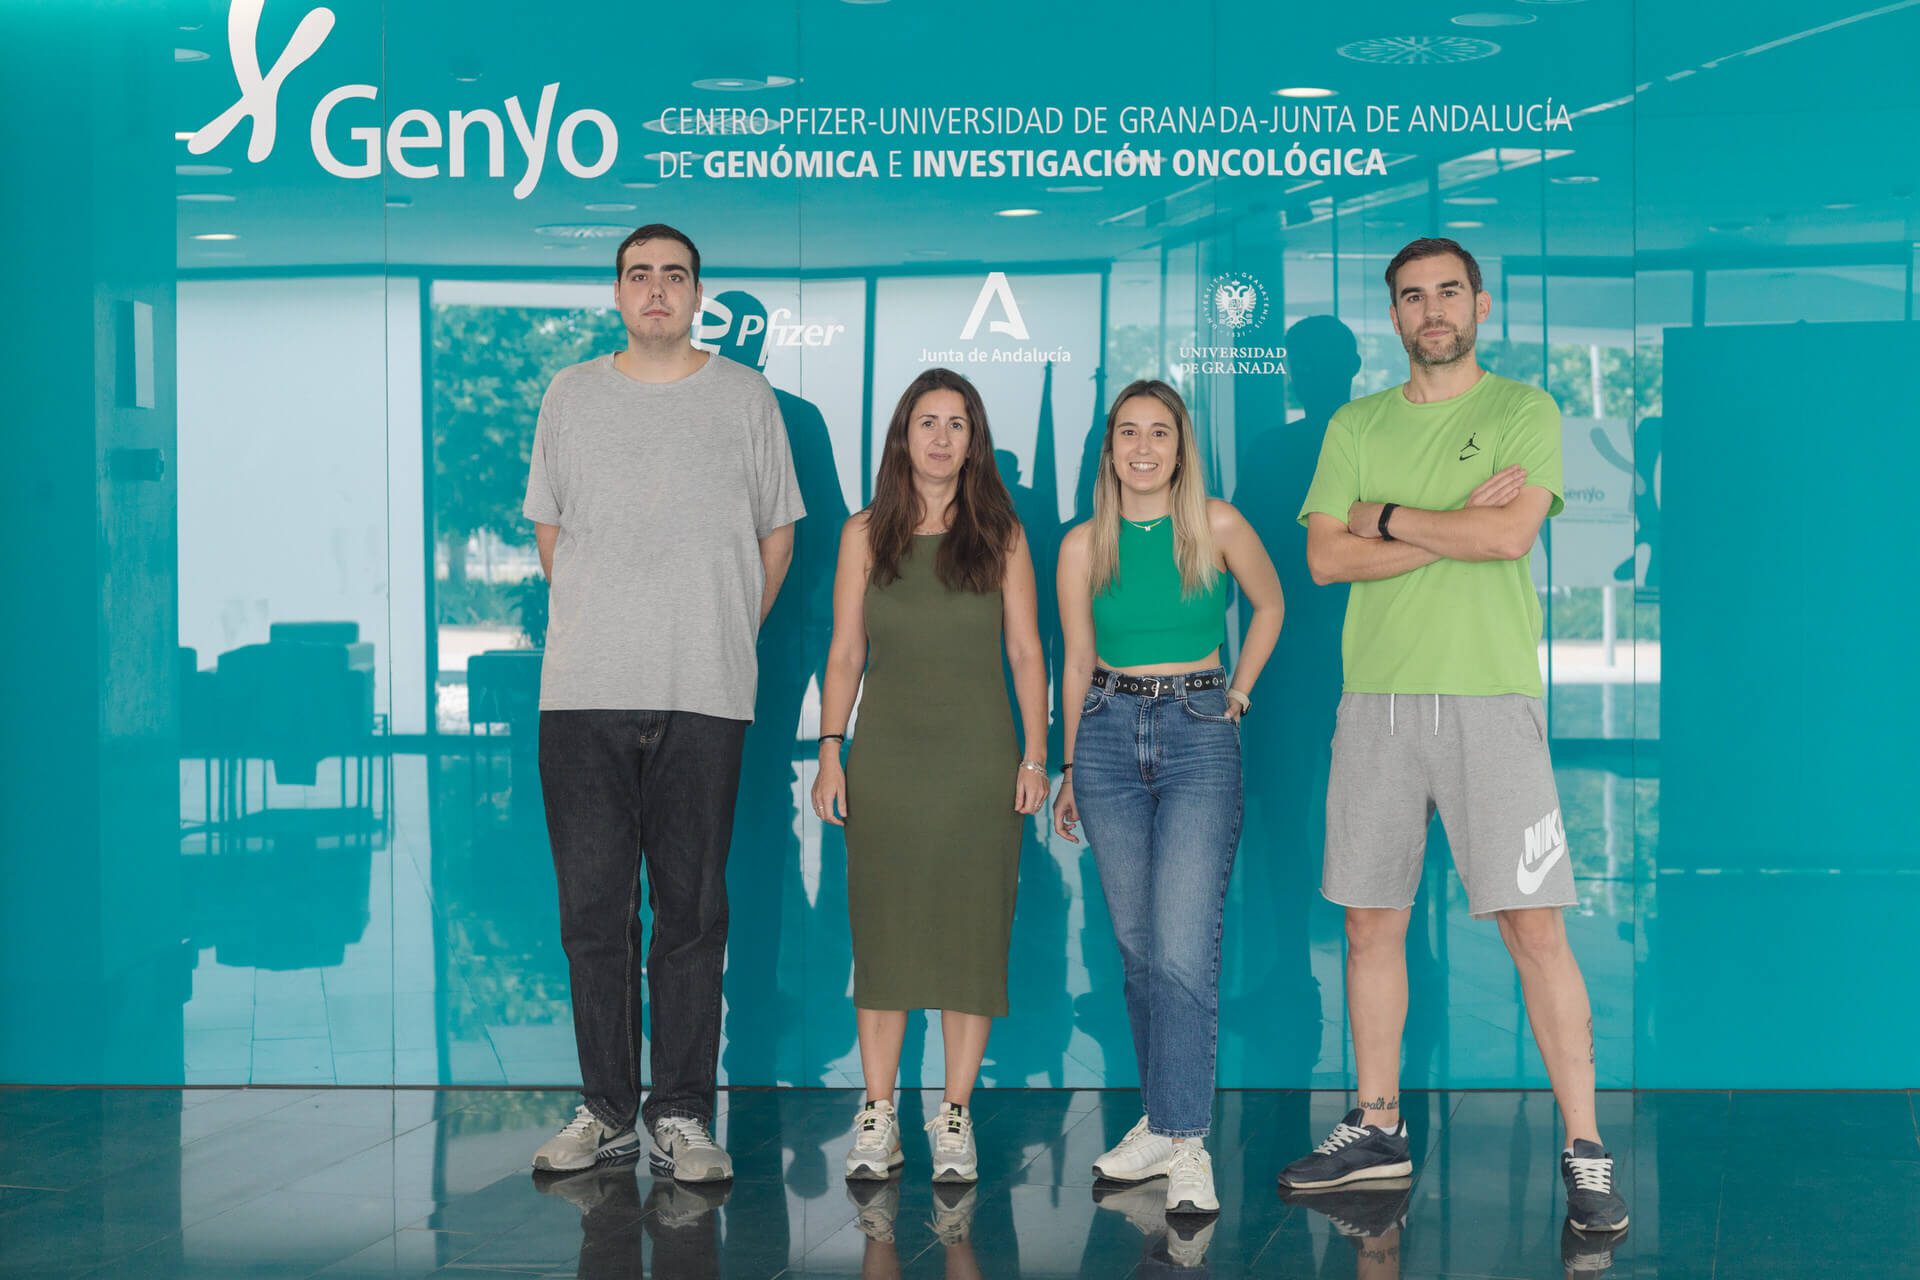
GENyO’s Cytometry Unit offers state-of-the-art single cell sorting and analysis services to scientists worldwide.
Members
Scientific Responsible
Technical Responsible
Research support technicians
Service Portfolio
From cell analysis and sorting to training and support, Genyo’s Cytometry Unit offers state-of-the-art services to scientists.
Cell analysis by conventional cytometry, imaging and mass.
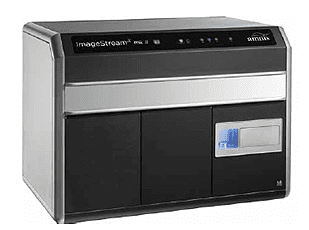
Amnis ImageStreamX MkII imaging cytometry
Best described as a high-performance microscope, this equipment allows users to take a high-resolution image of every event and overlay flow data with microscopy images. It combines the speed, sensitivity and phenotyping ability of flow cytometry with the detailed imaging of a fluorescence microscope including Brigthfield and Darkfield (SSC) and up to 10 fluorescent markers.
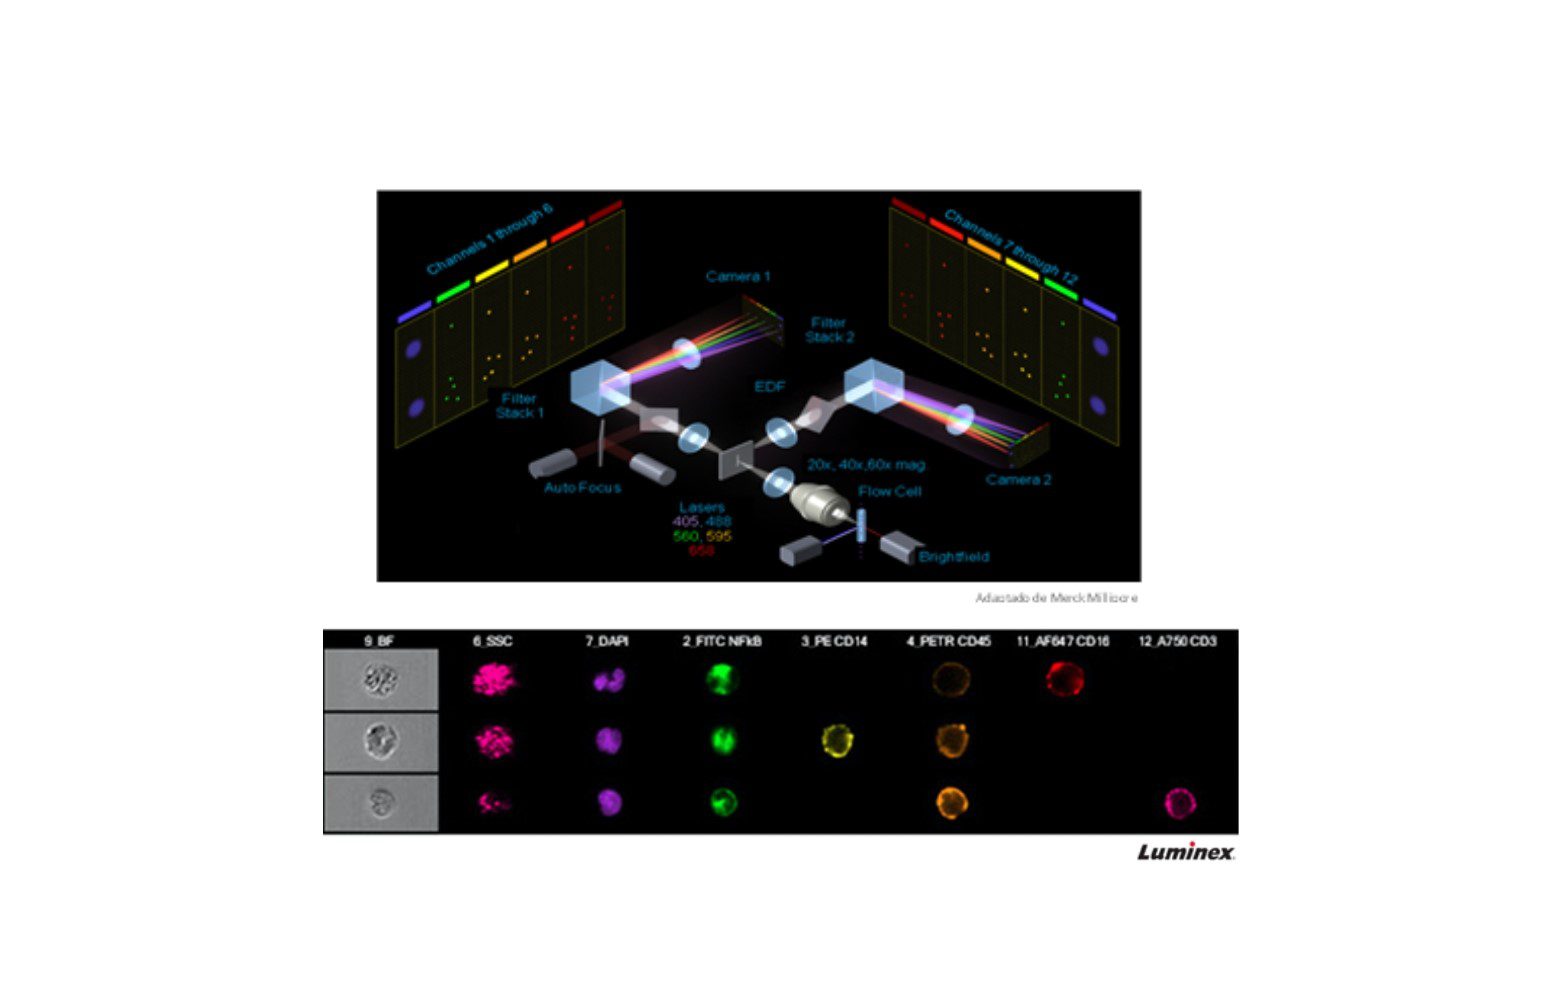
This cytometer is essential if you are interested in changes in morphology, co-localization or translocation of structures within cells, internalization, you can also see extracellular vesicles, etc.

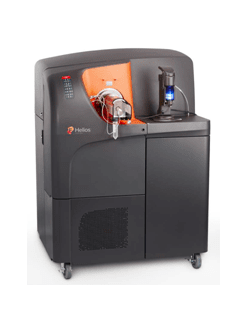
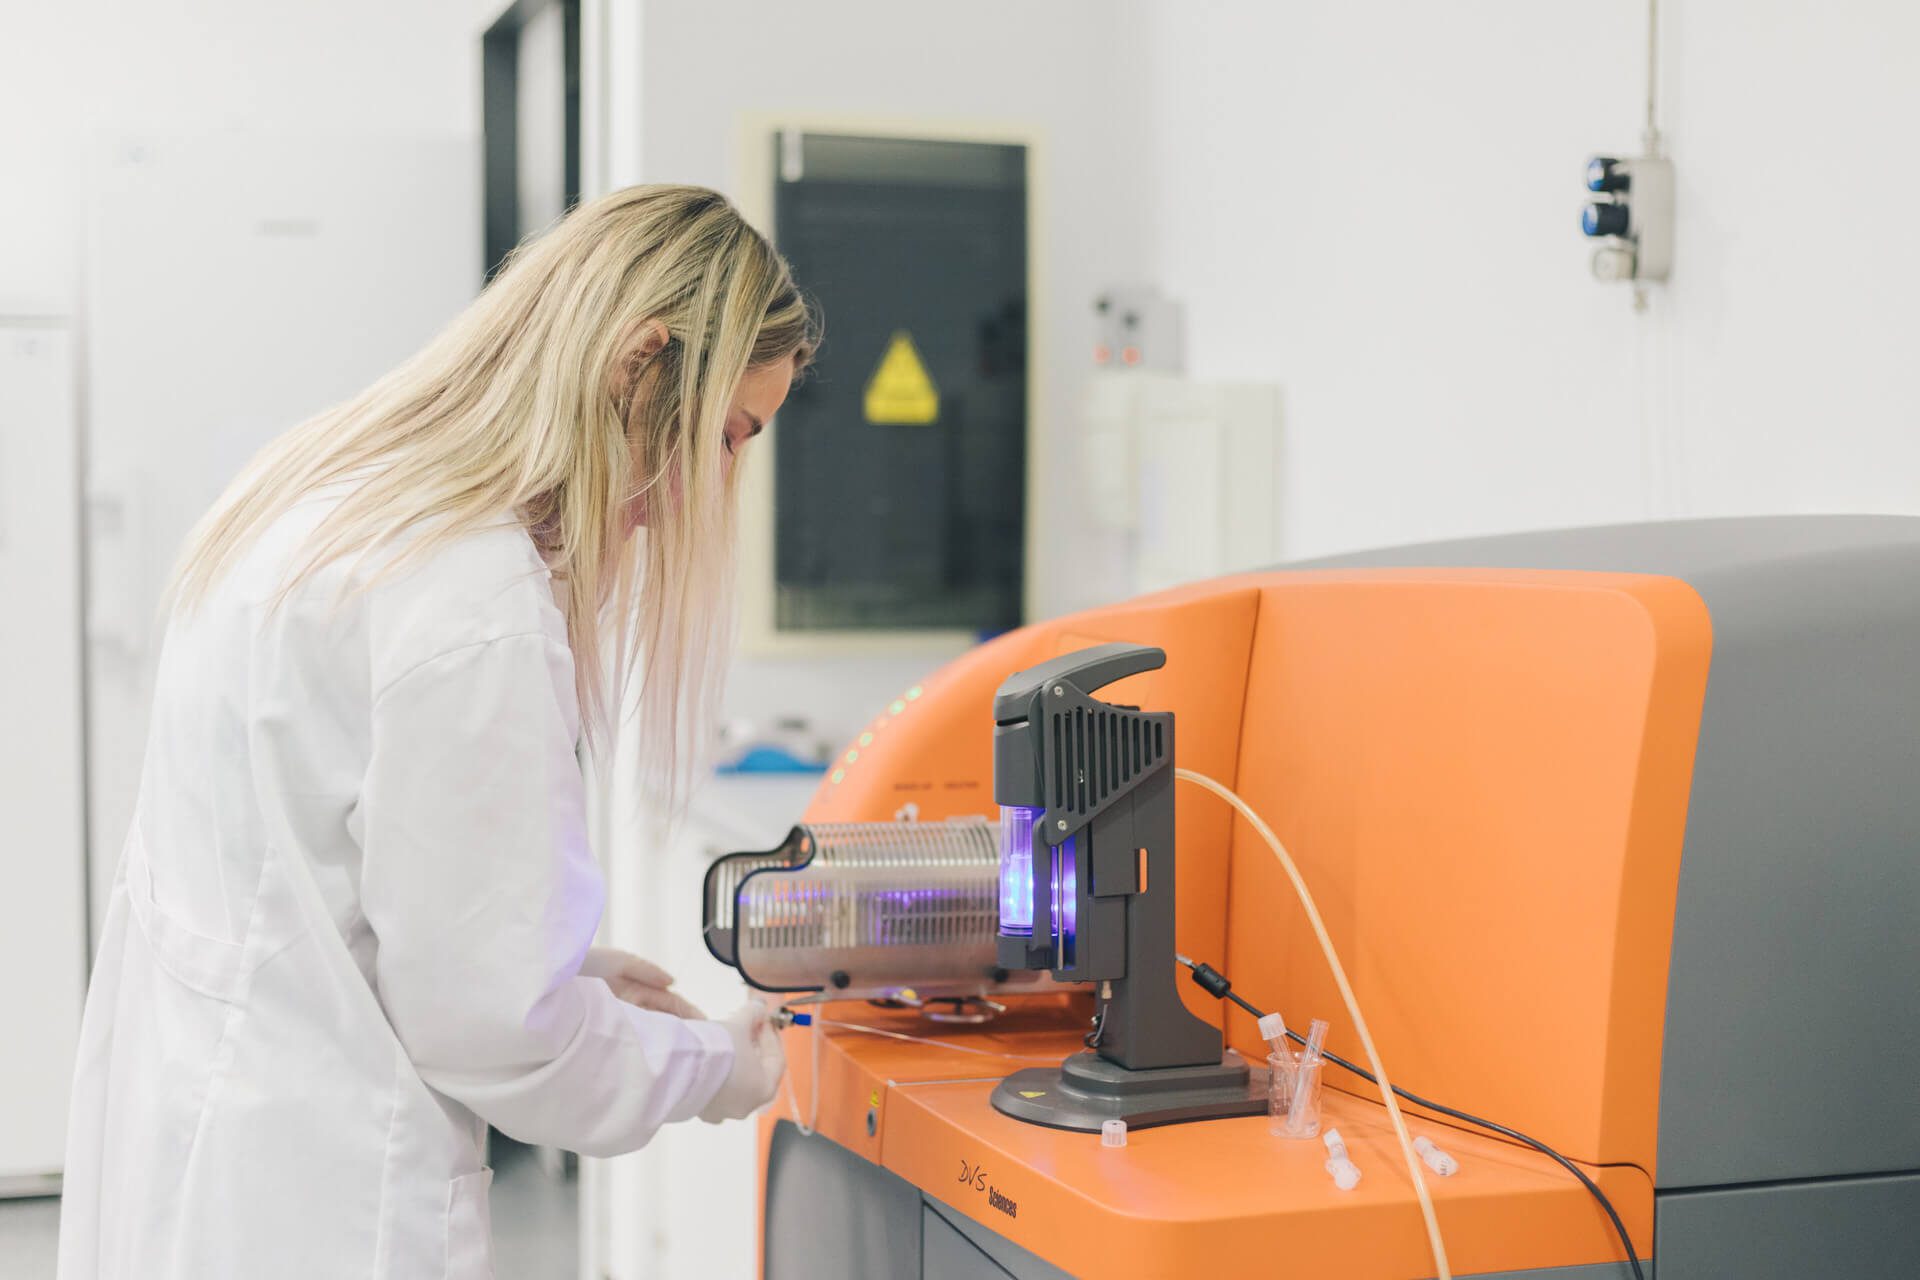
Mass cytometry
A few years ago, the problem of overlapping and background noise from the emission spectrum of fluorochromes led to the search for new solutions capable of simultaneously measuring a multitude of parameters in a single cell.
Mass cytometry, or time-of-flight cytometry (CyTOF®), allows a better understanding of the research by allowing simultaneous measurement of more than 40 parameters in millions of cells.
CyTOF analyzes single cells labeled with stable metal isotopes using an inductively coupled plasma and state-of-the-art time-of-flight (TOF) detection technology. With 135 detection channels, CyTOF can simultaneously resolve multiple probes at high acquisition rates, maximizing the information per cell obtained from a single sample. Since heavy metals are ionized, discrete signals from each metal marker are detected as a function of their atomic mass rather than their wavelength, at a resolution of 1 Da. The use of metal tags significantly reduces signal overlap, enabling much greater multiplexing than that achieved with fluorescence signals.

Cell analysis by conventional flow cytometry
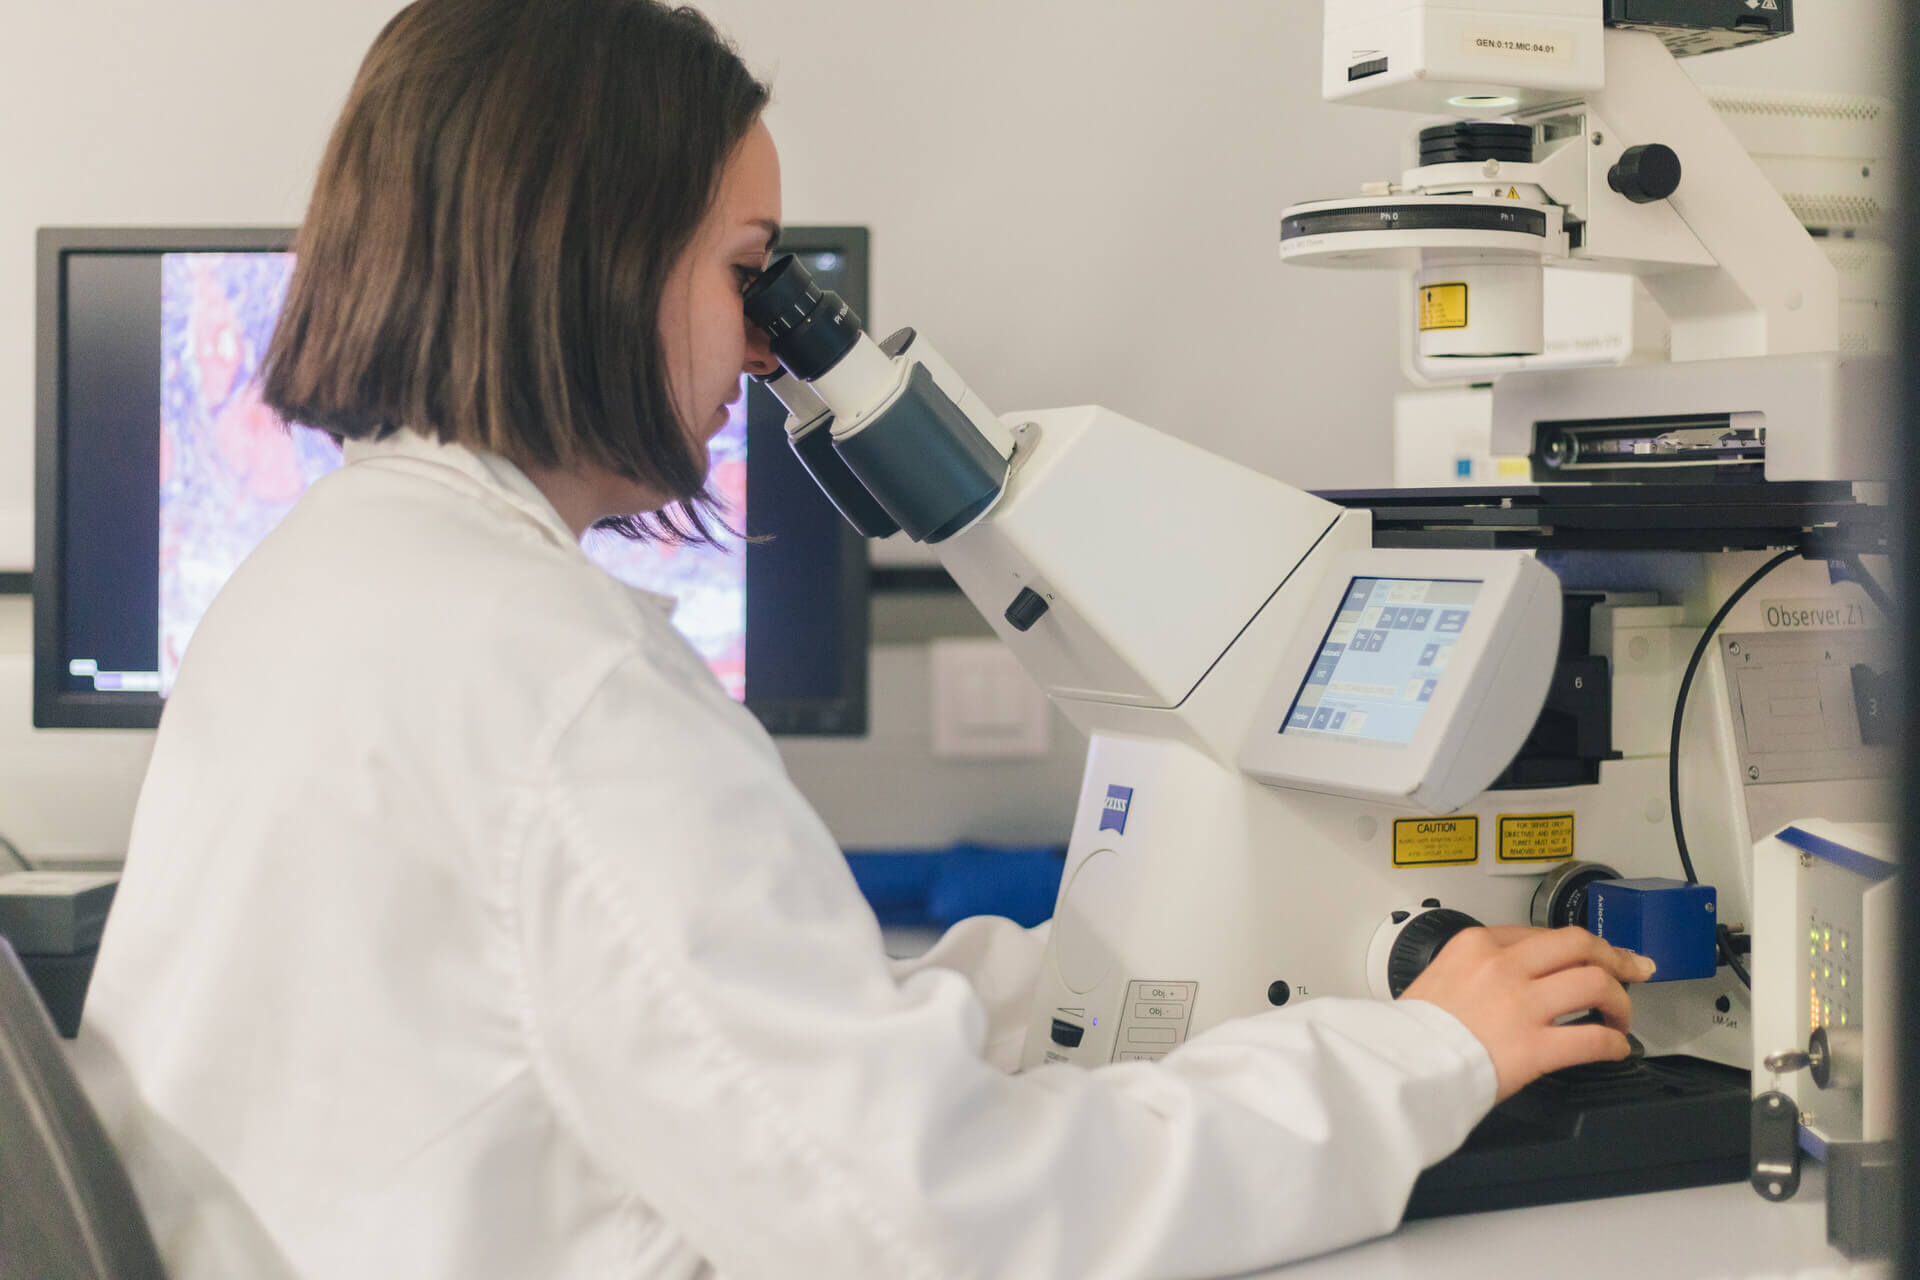
The basis of conventional flow cytometry is based on passing a suspension of particles (epitopes, proteins, DNA, exosomes, exosomes, nanoparticles, etc.) labeled with fluorochromes and/or fluorescent proteins in an aligned manner in front of a focused laser beam.
The impact of each fluorochrome or fluorescent protein with the laser beam produces an excitation of the fluorescent molecule, which is picked up by the cytometer detectors. These detected light signals are transformed into electrical pulses that are amplified and converted into digital signals, which are processed by a computer.
Flow cytometry uses a laser as a source of excitation, which is incident on a biological particle labeled with fluorochromes that are bound to the molecules of interest.
Cell Sorting by Sorter
Cell sorting by flow cytometry or “Cell Sorting” is the process of physical separation of particles based on the differential expression of one or more parameters that can be analyzed by conventional flow cytometry techniques. The great potential of multiparametric analysis for the identification of highly specific populations should be emphasized. By means of a sorter we can recover a high percentage of particles of interest, together with a high purity close to 99%.
Bioplex200 Immunoassays
Bio-Plex 200 is a suspension array system that offers researchers using proteins and nucleic acids a reliable solution for multiplex assays, enabling the analysis of up to 100 biomolecules in a single sample. It uses technology that combines two lasers with high-performance fluidics and real-time digital signal processing to distinguish up to 100 different colored bead arrays. The reagents for these assays (antibodies, oligonucleotides, substrates, etc.) are anchored to the surface of polystyrene microspheres.
These beads can be calibration beads with known fluorophore ratios or control beads, ranging from carboxyl groups to Avidin for covalent binding of different biomolecules and biotinylated ligands respectively, so that whatever is needed can be hybridized to the surface of the beads.
Sample analysis
The analysis of results in flow cytometry is performed on the basis of quantitative information obtained from the particular sample, which allows the identification of subpopulations within a sample, even when they are poorly represented. The data generated in the analysis are presented statistically, showing the percentage of the population of interest that meet certain criteria. The mean fluorescence intensity parameter can also be used.
The software available in the Unit for data analysis are listed in the following table.
|
Analysis software |
|
FlowJo 10.10 (BDbiosciences) |
|
FACSDiva 8.0 (BDbiosciences) |
|
FACSSuite 2.0 (BDbiosciences) |
|
IDEAS 6.2 (Amnis, Cytek) |
|
OMIQ, LLC |
Training and orientation
- Initiation and training of the different users who use the analyzer cytometers for the first time.
- Assistance to users in problems with the equipment.
- Assistance on methodology and experimental design.
- Assistance and help with sample analysis.
Equipamiento


